In this work I made a choropleth map with Folium, a flashy python library for data visualization.
Intro
This project serves to visualize how much grant money goes to each Swiss canton for research purposes in the past 30 years.
Folium makes a good option here since it’s pretty lightweight and involves leaflet.js maps.
Deliverables
Rather than diving deep into the process, I want to show the choropleth map in the first place.
Link to the map (it’s on free Heroku server, need 10 secs to activate)
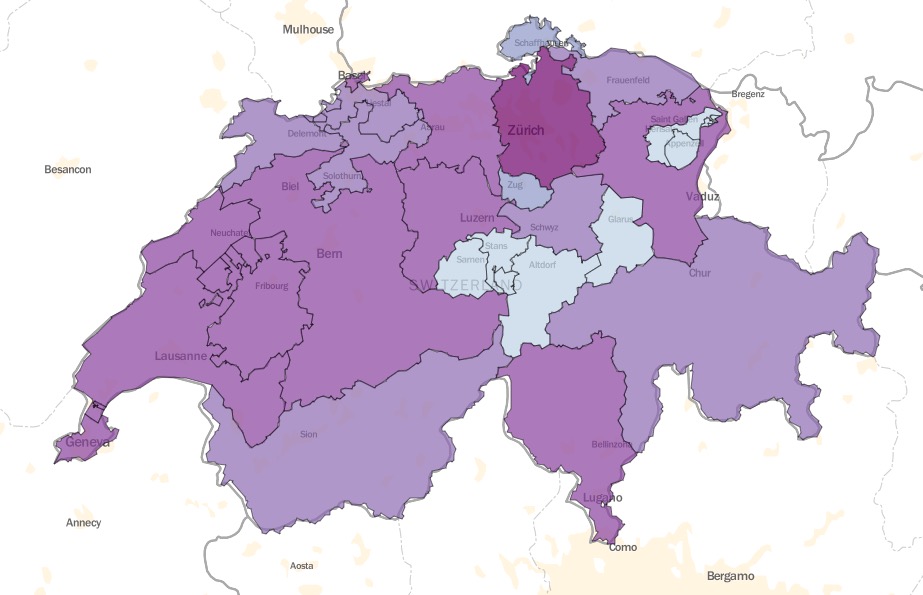
The interactive choropleth map is hosted at Heroku. You really need to check this website out if you want to serve online your personal work.
More work, of course, can be done to pop up some infomation when hovering your mouse over the cantons.
Data cleaning
The data comes a long way from Swiss P3 database. I will skip all the tedium here but address the steps involving googleplaces.
googleplaces
With googleplaces you can query with a place’s name, in the form of a string probably, and get all the GIS information, i.e. longitude, latitude, country and canton names.
The code snippet is as follows.
from googleplaces import GooglePlaces, types, lang

uni = 'Universität Bern - BE'
google_places = GooglePlaces('SOME_HIDED_KEY')
response = google_places.text_search(query = uni)
if response.places:
    place = response.places[0]
print(place) # <Place name="University of Bern", lat=46.9504896, lng=7.438119000000002>
Now with some easy look-up in the documentation we are in full possession of well structured data.
place.get_details()
details = place.details
for component in details['address_components']:
    if 'administrative_area_level_1' in component['types']:
        canton = component['short_name']
print(canton) # BE
Visualization with Folium
Once the dataset df is done it’s really easy to implement Folium. You need to create a folium map object in the first place. Specifying tiles, zoom level and starting position properly will save a lot of time for you.
Then we need an object containing topology information, mostly in the form of JSON to 1) convey the data from df and 2) overlap with the folium map.
topo_path = r'ch-cantons.topojson.json' # local topojson file
scale = np.linspace(0, np.max(countDF.Grant), 6)

import folium

map4 = folium.Map(location=[46.57, 7.27], tiles = 'Mapbox bright', zoom_start=8)
map4.choropleth(geo_path=topo_path, topojson = 'objects.cantons', data = df,
    columns=['Canton', 'Grant'],
    threshold_scale=list(scale),
    key_on='feature.id',
    fill_color='BuPu', fill_opacity=0.7, line_opacity=0.2,
    legend_name='Total grants per Canton in a log scale')
With map.choropleth() you can create a choropleth map with JSON file and dataset. Most handlers are identical to matplotlib handlers. Opacity and color handlers are the only handlers you need to pay extra attention. For more options it’s always a good idea to look up the documentation. In fact the whole documentation of Folium is no longer than 12 pages. It’s probably the shortest documentation I have ever seen.
Well, but it’s still a cool library with style, isn’t it:)
Credits
This work is part of my EPFL Applied Data Analysis Homework. It enjoys colossal contribution from my teammate Carlos Malanche.
The source code is served at Github.