In recent years, the term Expected Goals (xG) has risen to prominence in football analytics. Being a low scoring game, xG provides with a rather clear insight instead of the score itself. Today I would like to present a related metric called xG outperformance to describe how good a player is at finishing.
xG Outperformance
xG outperformance(xGop) describes the value of extra goals every time a player has shooting chances that worth 1 xG. We could use xGop to describe a player’s finishing skill.
xG outperformance = (cumulative goals from shots / cumulative xG from shots) - 1
We could use an example to further explain xGop: Robert Lewandowski has 135 shots in total in season 20/21, and the sum of each shot’s xG is 32.08.
In fact, Lewy scored 41 goals, which makes his xGop 0.278 (score 0.278 “extra” goals for chances that worth 1 xG) that season.
Visualization
I have scrapped the seasonal xG data until now for all players that have scored more than 60 goals (or 60 xG) in the top 5 european leagues since 2014/15. The following plot presents the cumulative xGop for each player included.
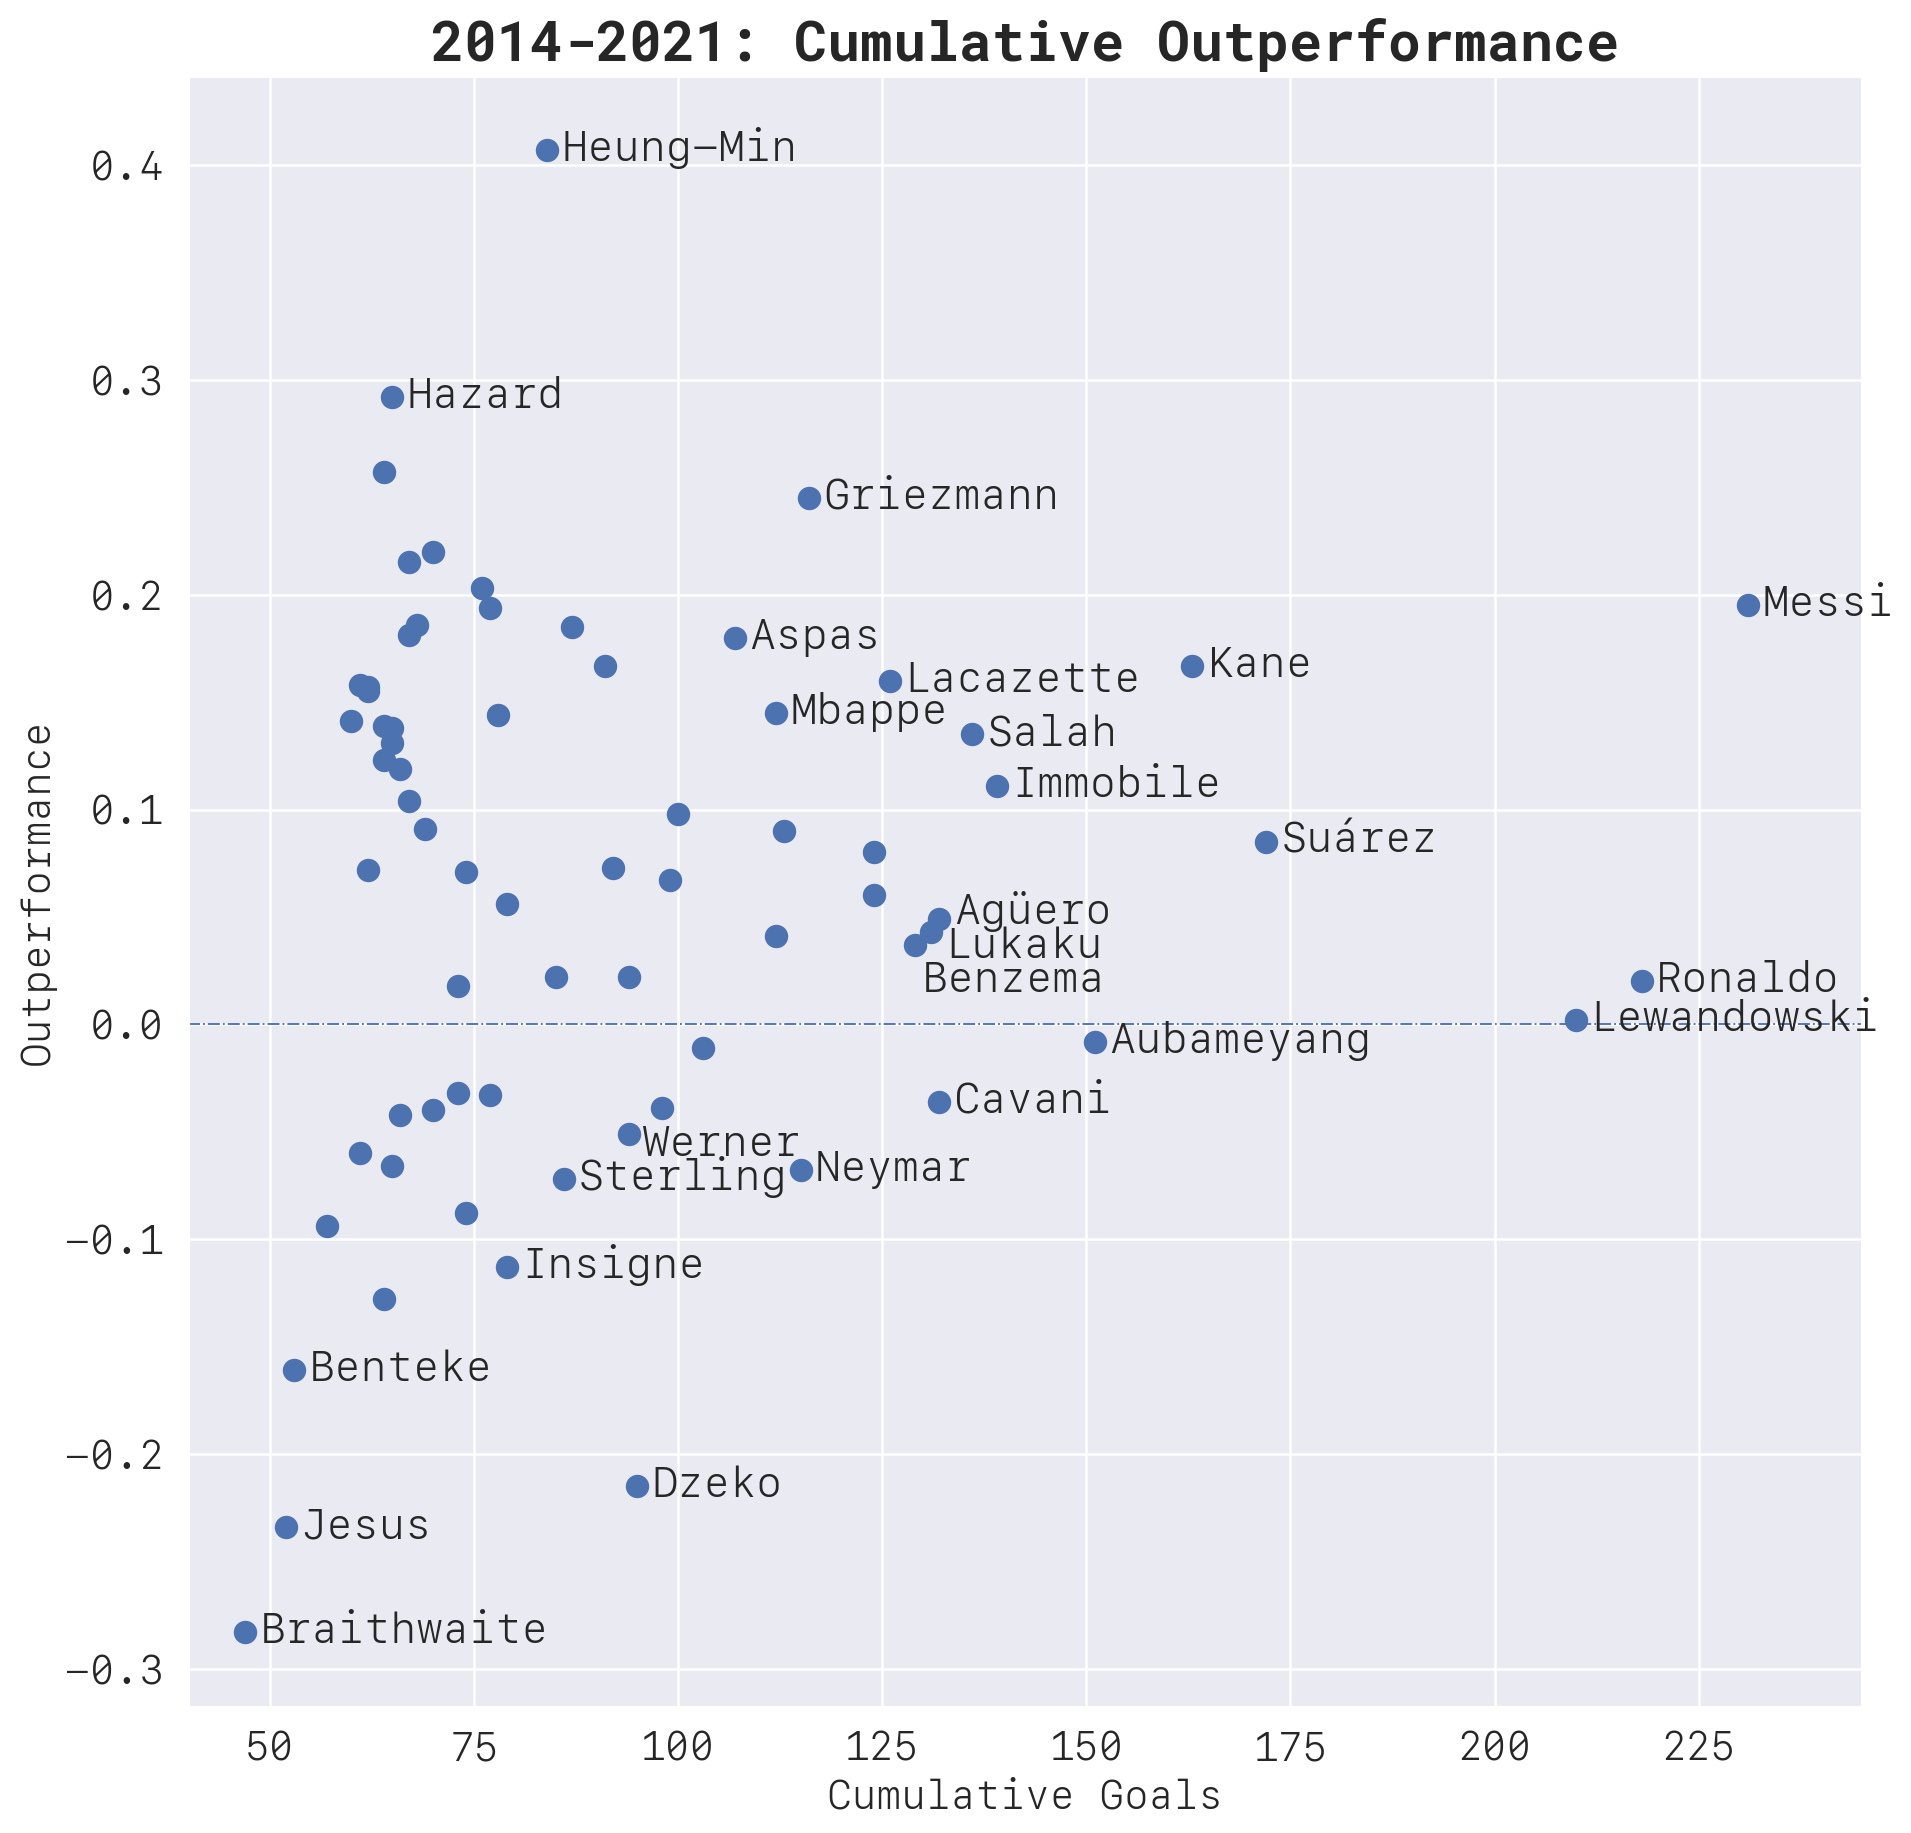
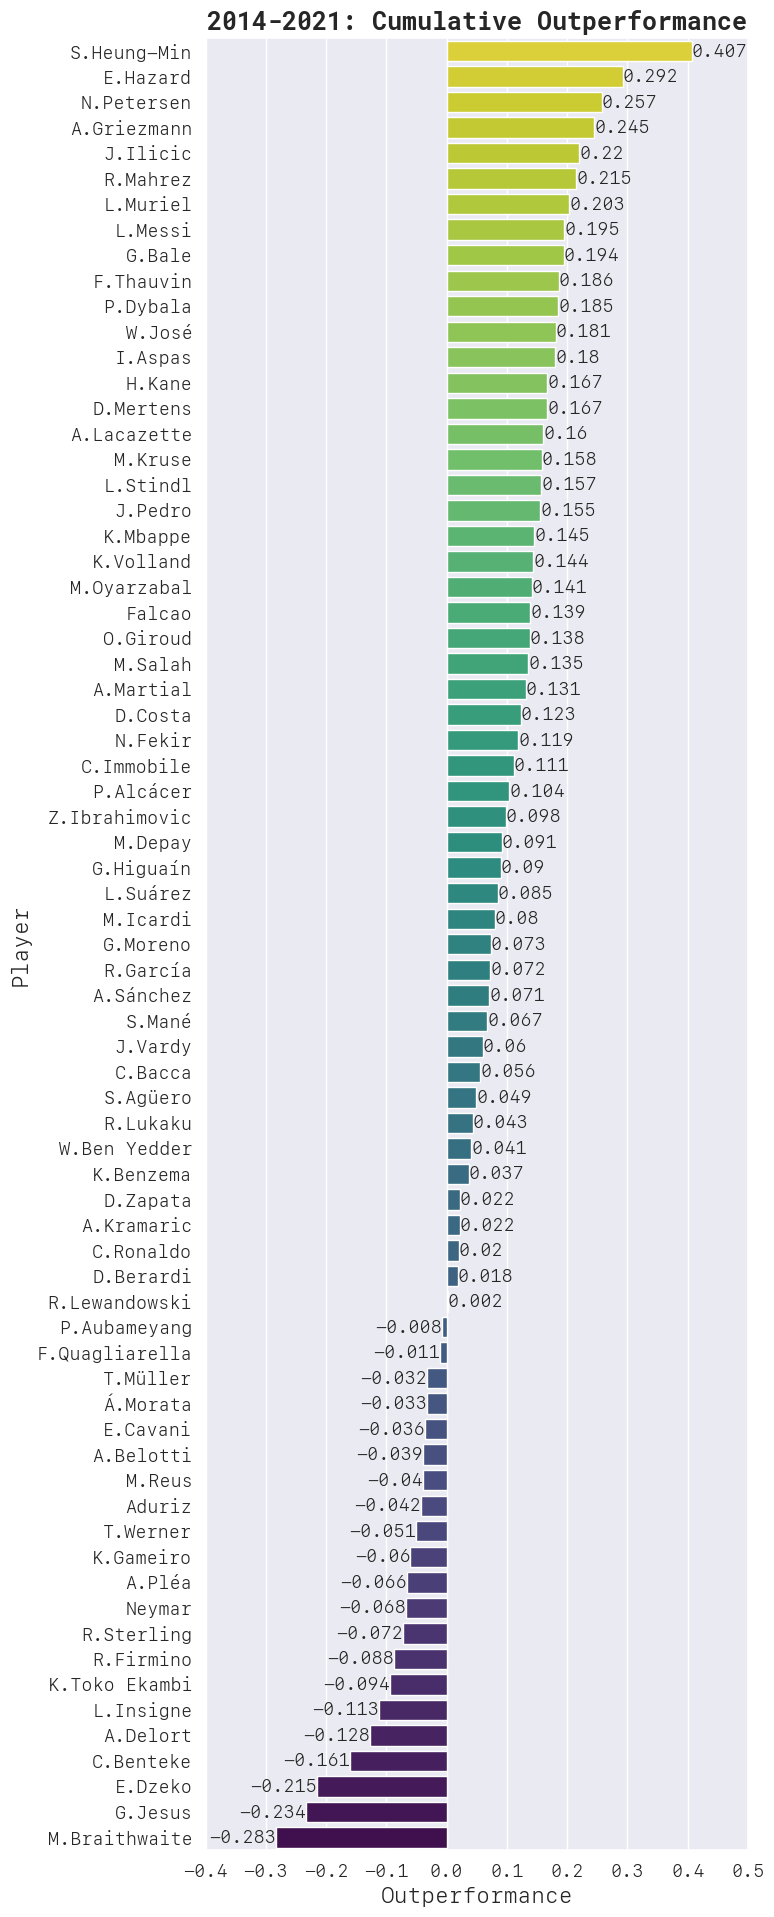
Also, you can find below the detailed ranking of each player.
Player notes
Son Heung-min is absolutely THE finishing beast here. He has an xGop of 0.408, 0.115 higher than second-placed Eden Hazard. Also, his performance is consistent between seasons and leagues, performing well at Leverkusen and Tottenham uniformly. To dive a bit deeper, it’s Son’s long shot that makes him truly outstanding. He has 17 goals from outside of the box with shots of 6.3 xG worth.
Eden Hazard and Nils Petersen are the other two members in the 0.250-and-above club, and they both surprise me. Hazard is a world class playmaker on top of his finishing skill. Petersen is one of the few target-men out there who ranks atop.
Messi again proves that he’s among, if not exactly, the GOAT out there. He ranks first in the goals scored AND has an xGop of 0.195. I can imagine it’s exponentially harder to keep a high xGop as the cumulative goals or xG goes up. People just can’t find a way to limit Messi. Harry Kane has comparably both quality and quantity at bank, but both stats would considerably shrink.
On the other side of the table, Braithwaite comes last but I haven’t seen any of his games at Ligue 1. Statistics show that Braithwaite is awful in almost EVERY season.
Manchester City is spearheaded by two big underperformers, Jesus and Sterling, with an xGop of -0.234 and -0.072 respectively. City (or Guardiola) is omnipresent in several big xG upsets. It makes me wonder if it’s Guardiola’s problem or the poor players’.
Further Notes
xG performance reflects only how clinical a player is. It doesn’t reflect the player’s ability to create chances. So don’t judge.